Tier0 adopts Marimo for easy python script usage. For example, you can train models, run SQL queries and design dashboards with data connected in Namespace.
Creating Notebooks
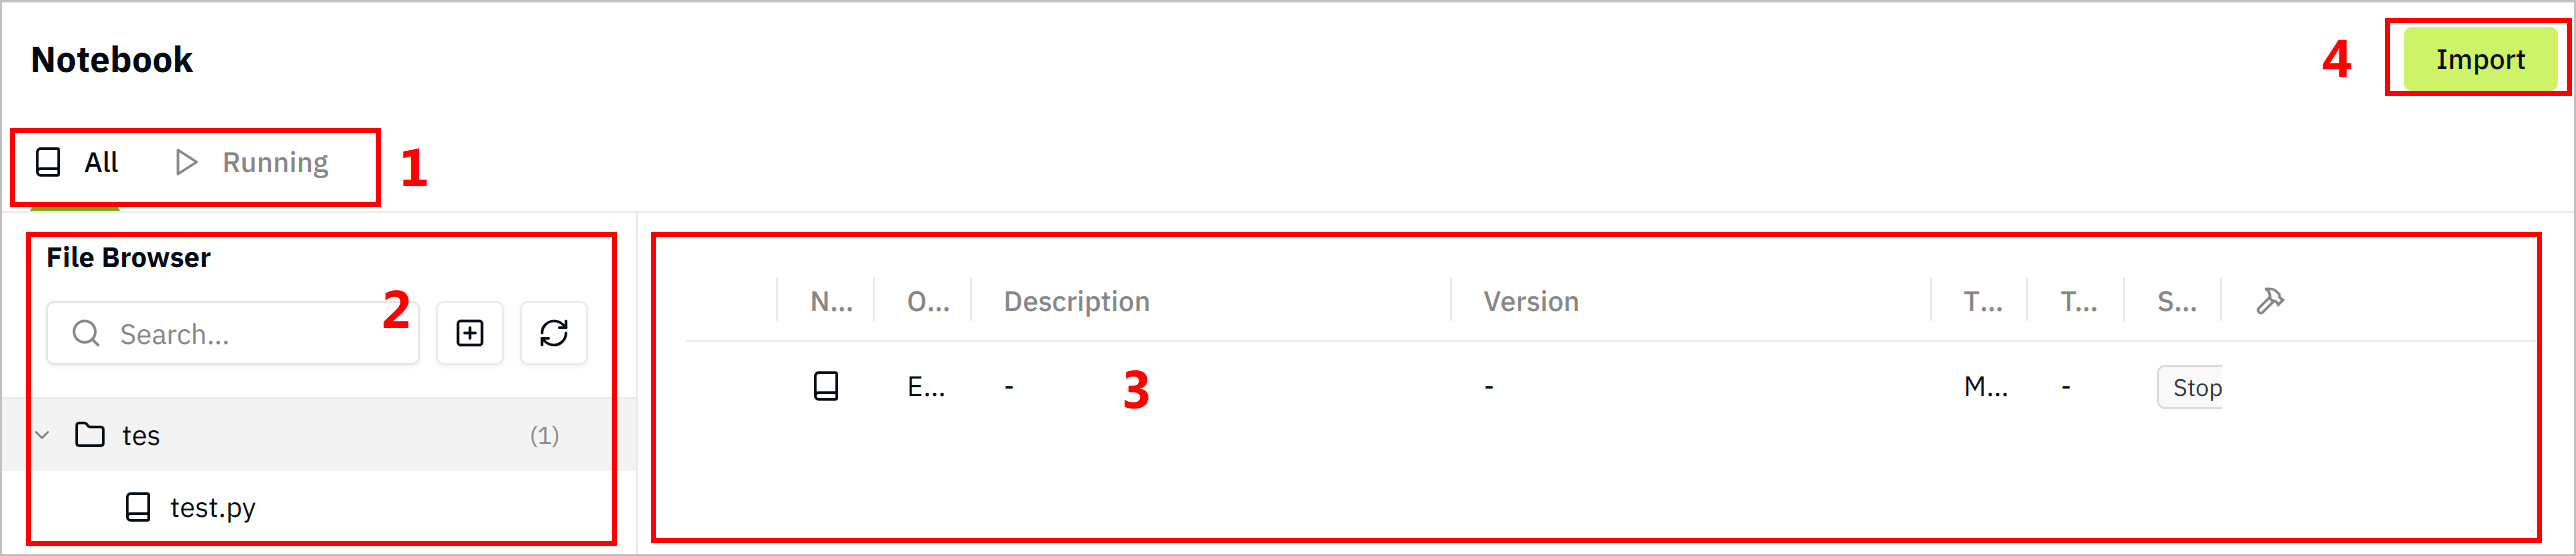
- Log in to Tier0, and then select Notebook.
| No. | Item | Description |
|---|---|---|
| 1 | Category | Displays notebooks by their status. |
| 2 | Notebook Treemap | Lists notebooks in a folder-file hierarchical manner, you can add notebooks, refresh lists and search for notebooks. |
| 3 | Details List | Displays all notebooks of the selected folder in details. |
| 4 | Import | Import notebooks. |
- Select
 > New Folder.
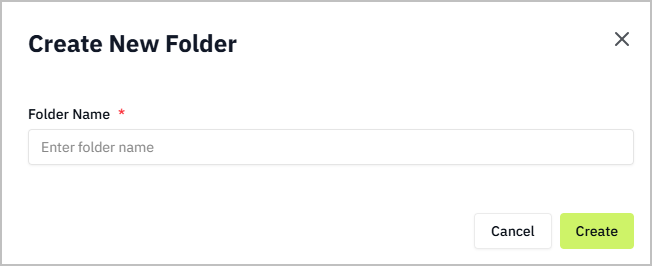
- Enter a folder name and click Create.
- Click the created folder, and then select > New Notebook.
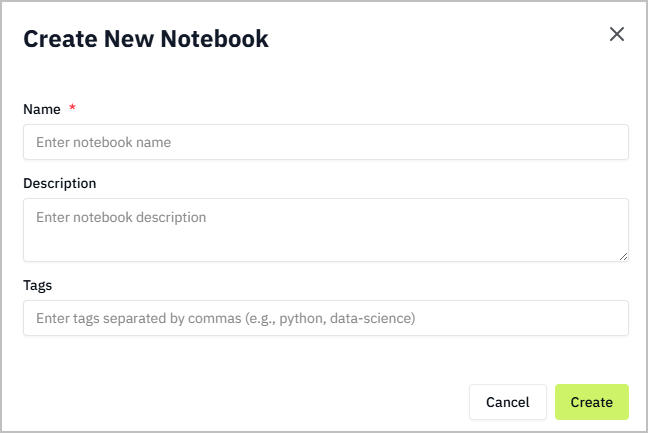
- Enter the notebook information and click Create.
- Click the created notebook on the right side, and start editing.
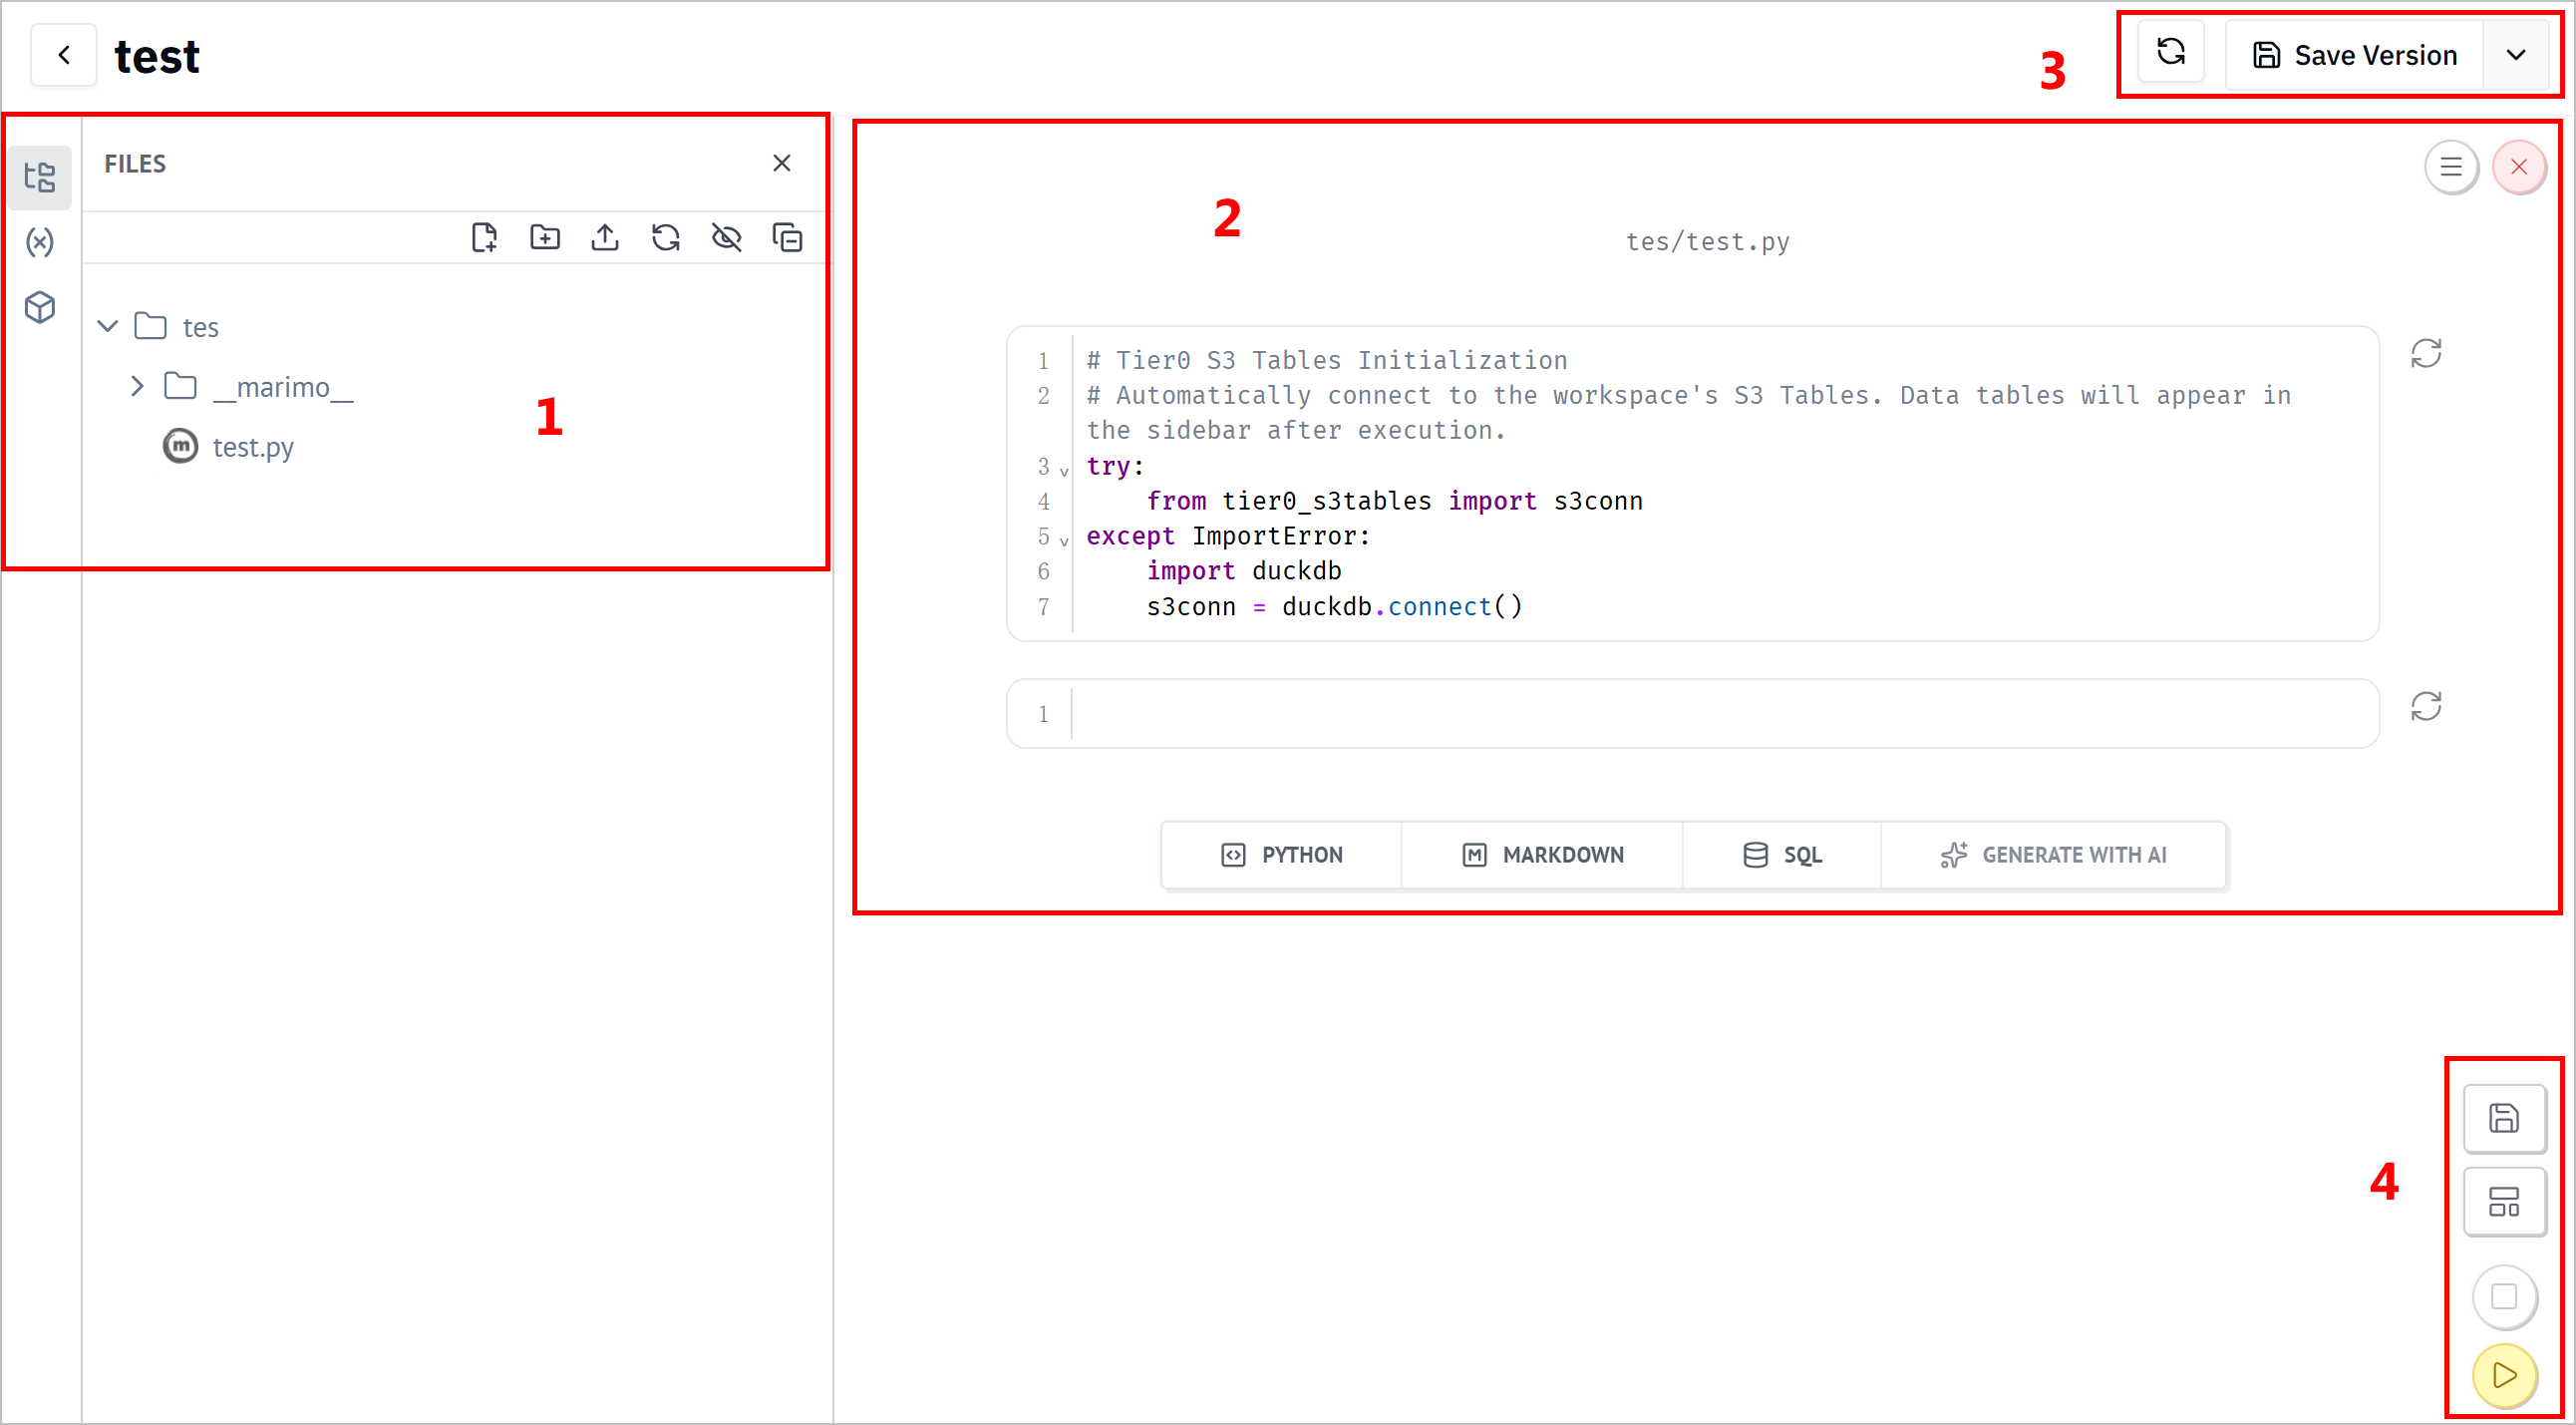
| No. | Item | Description |
|---|---|---|
| 1 | Category | Displays notebook hierarchy, data sources and dependency packages. |
| 2 | Canvas | Lists cells in the notebook. You can select to create different types of cells, shutdown the notebook and change its settings. |
| 3 | Tool Bar | Refreshes cells and save the notebook to different versions. |
| 4 | Operations | Save the notebook. change current viewer style between cells & result, and pure result. Stop/run all cells. |
Using Notebook to Run SQL Queries
-
Log in to Tier0, and then select Notebook.
-
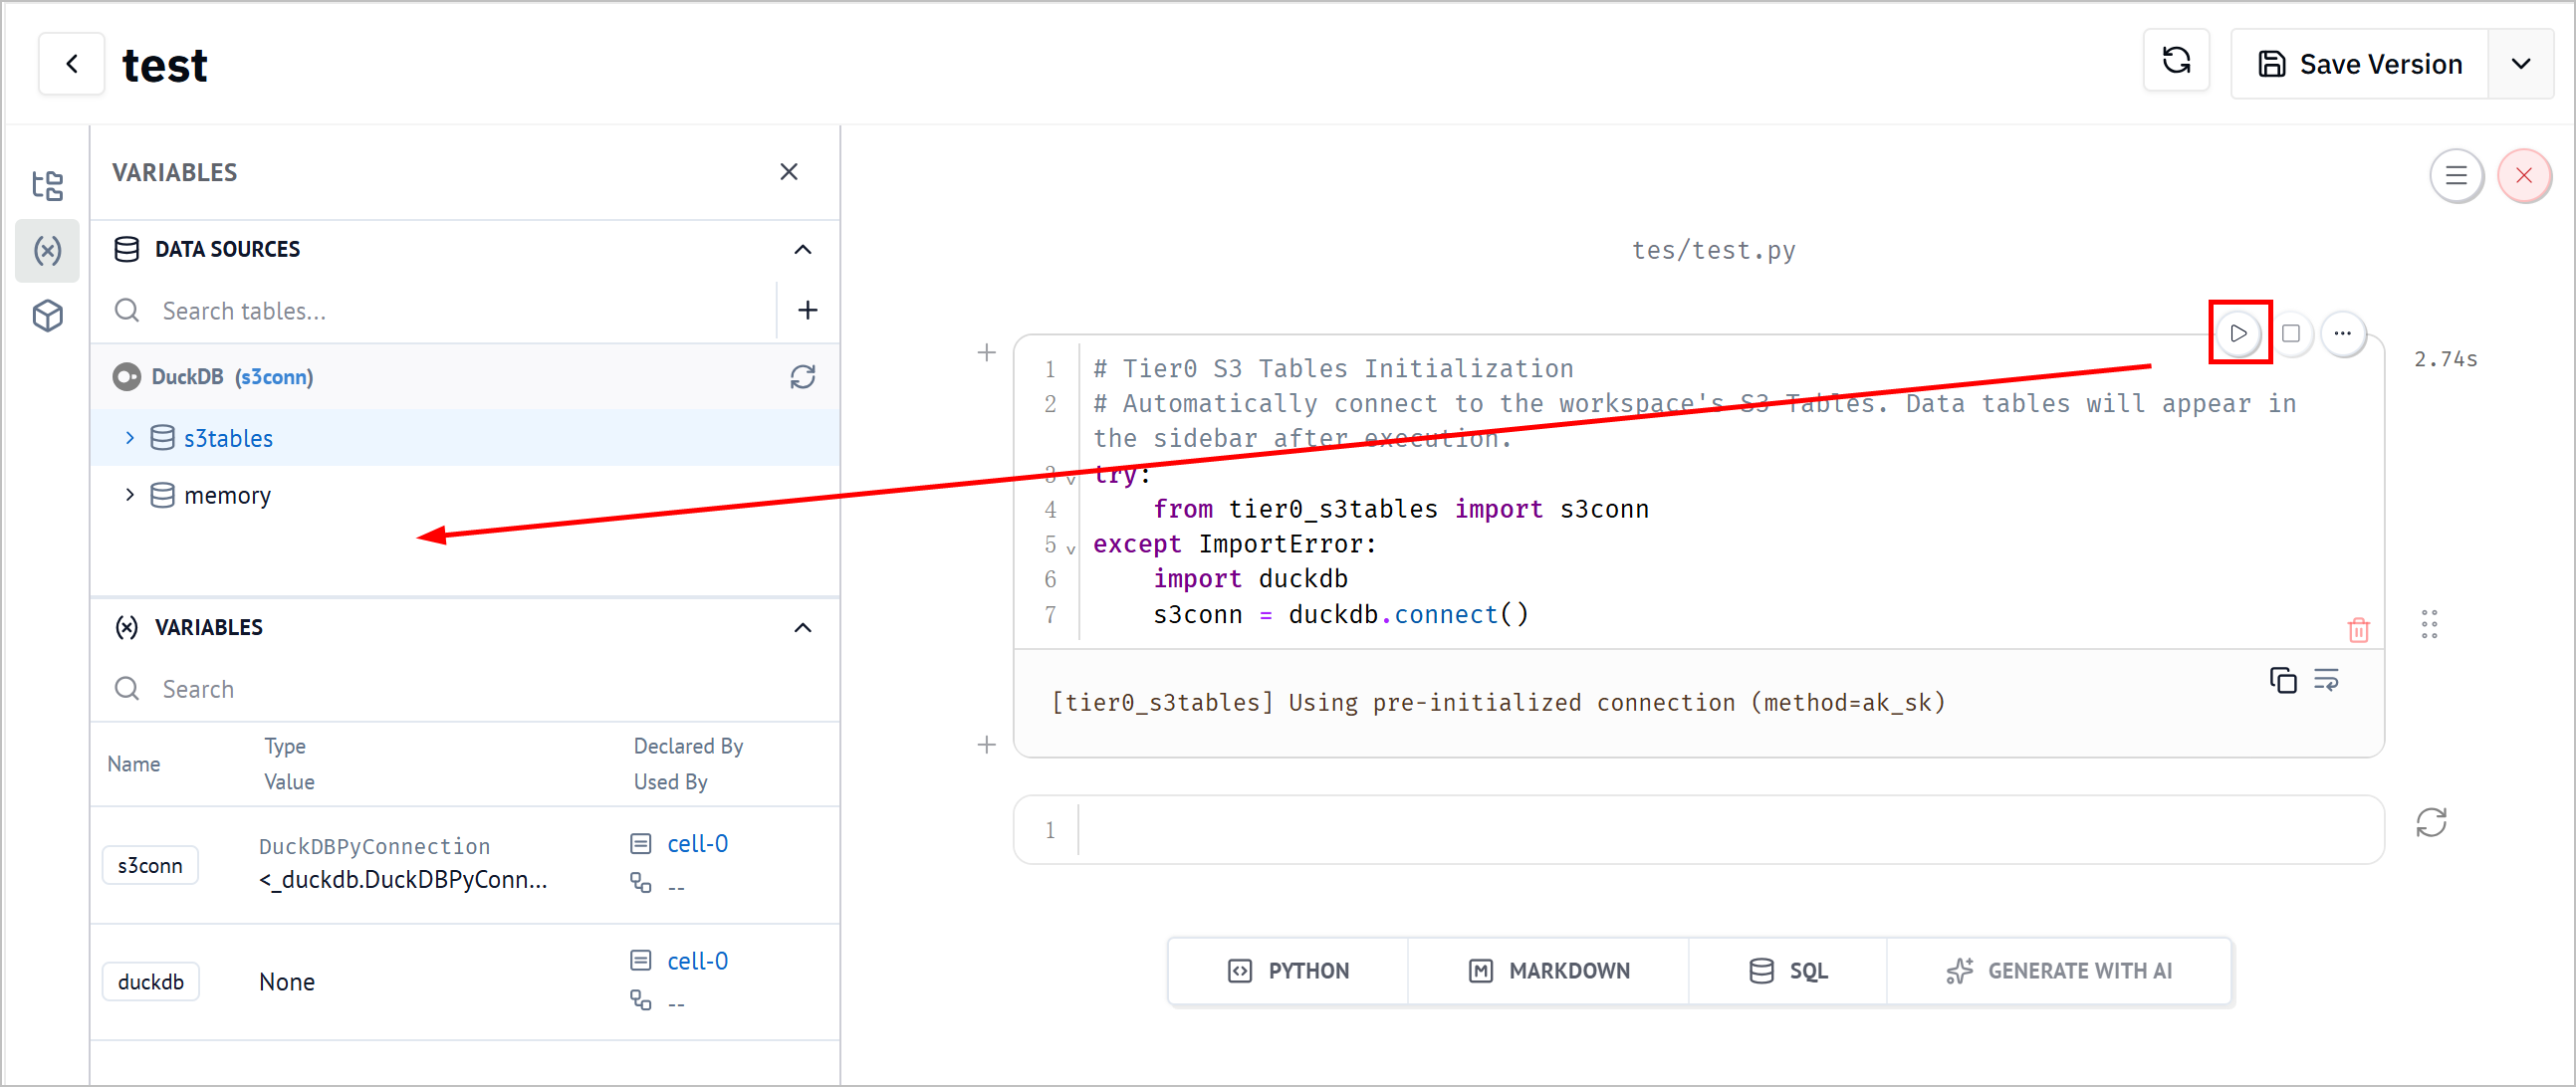
Enter the added notebook, and run the default cell to connect Tier0 namespace as data sources.
- Add a cell, write
import marimo as mo, and run it.

- Find the table you need on the left, click
 next to the table name to generate SQL statements automatically.
tip
- You can click
 under DATA SOURCES on the left to add sources as needed.
 - It can happen that certain packages are missing while connecting to some types of databases. In this case, click Manage packages on the left to install.
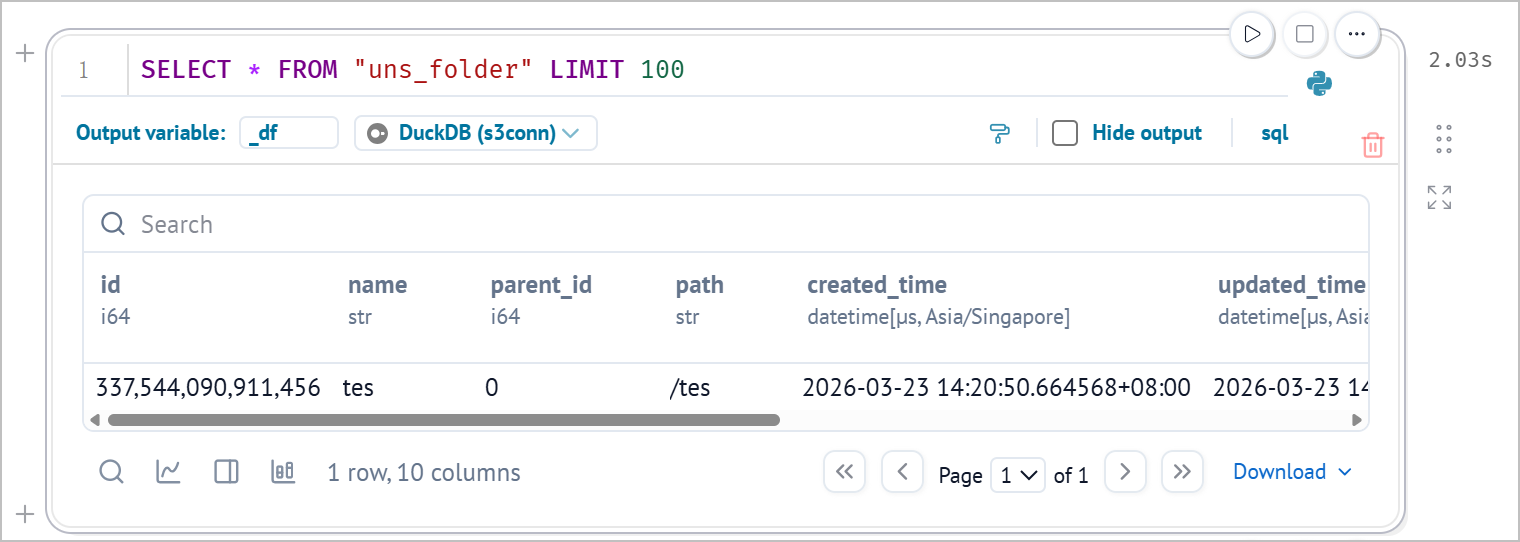
- (optional) Click SQL to add a new cell, and then select a connected database to run SQL statements.
Using Notebook to Draw Charts
- Log in to Tier0, and then select Notebook.
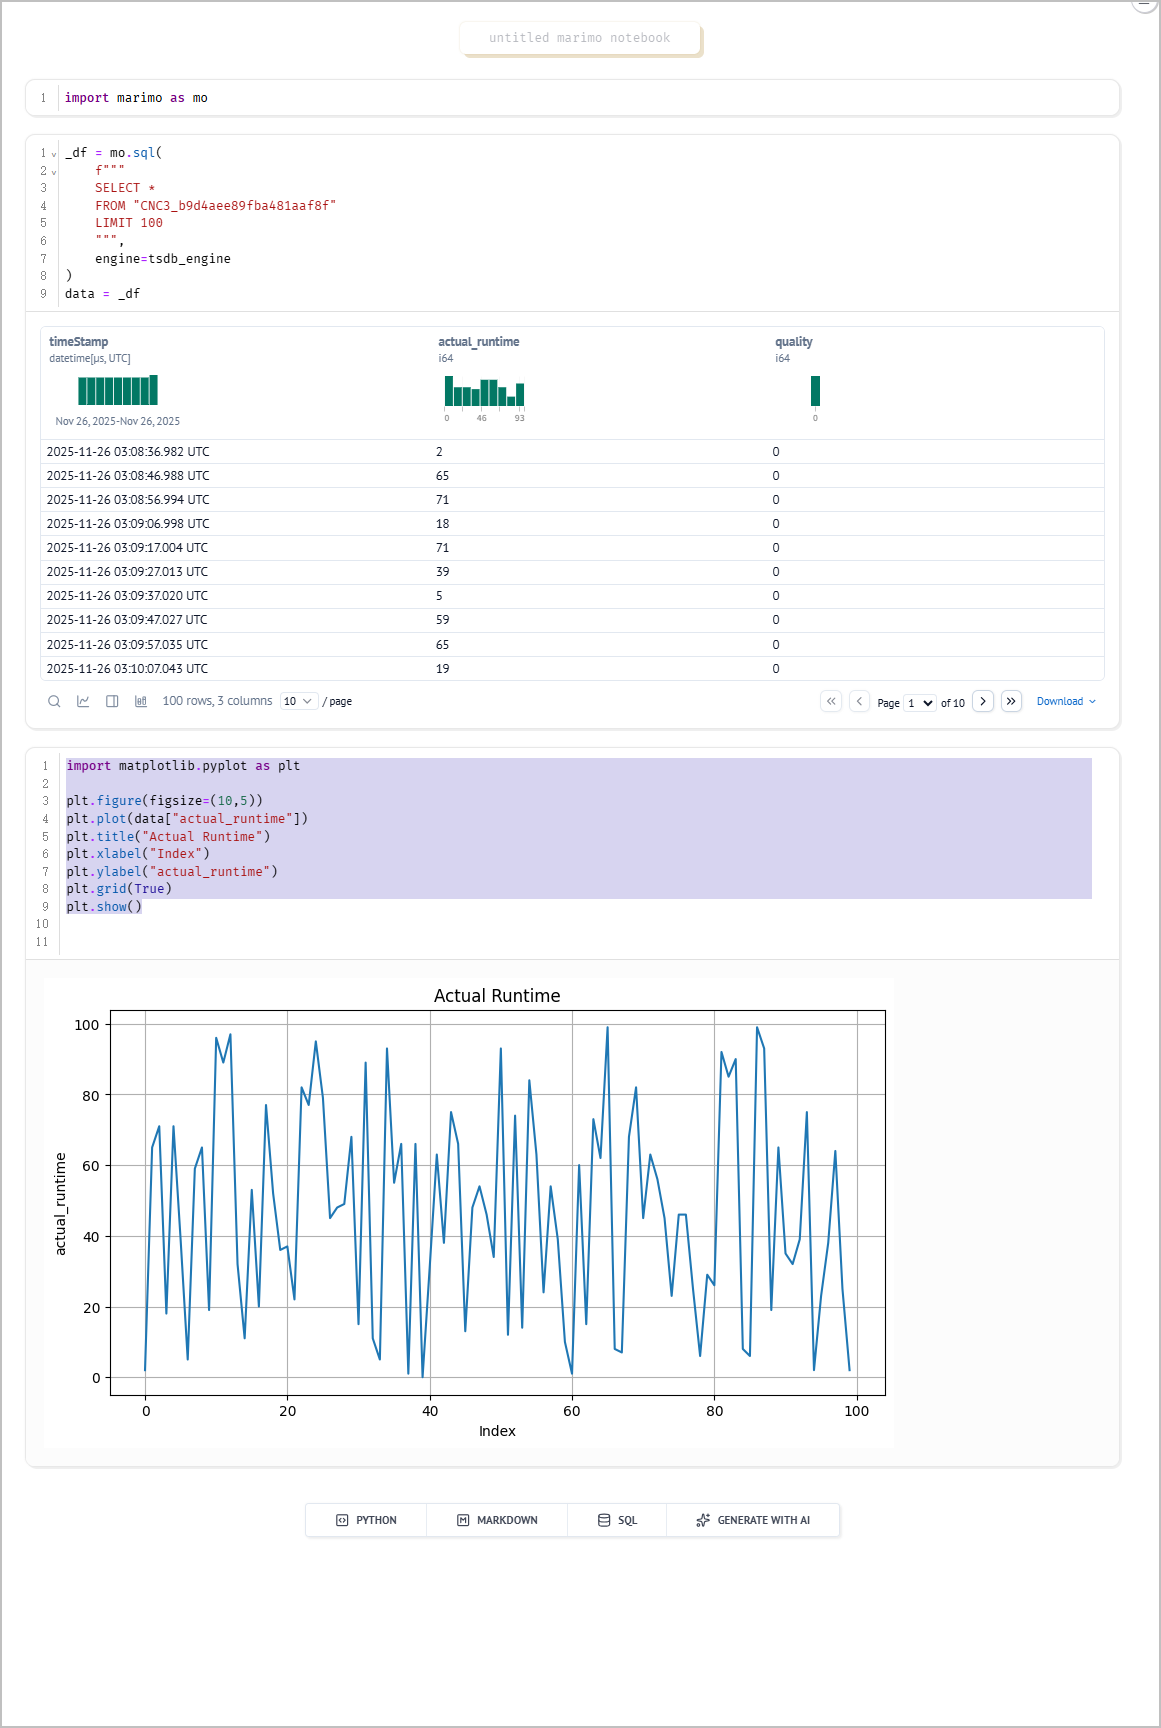
- Create a new notebook, and then add the following 3 cells to draw a simple line chart.
- Cell 1: Import libraries
import marimo as mo
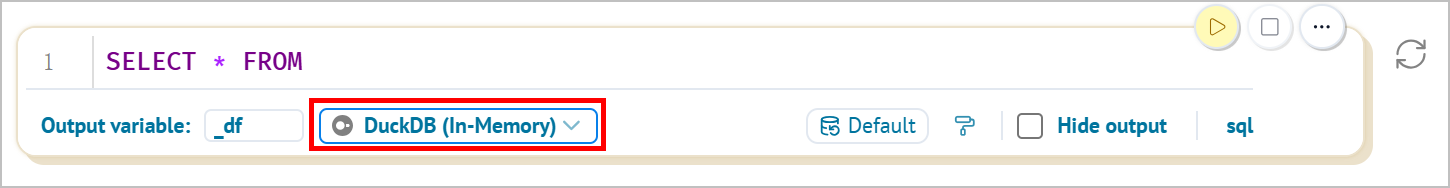
- Cell 2: Query data from the database
_df = mo.sql(
    f"""
    SELECT *
    FROM "table_name"
    LIMIT 100
    """,
    engine=tsdb_engine
)
data = _df
tip
Use a SQL cell to write queries and then click  on the cell end to switch the cell to Python. Make sure you assign the query result to a variable (e.g.
 data).
- Cell 3: Draw a line chart
import matplotlib.pyplot as plt

plt.figure(figsize=(10,5))
plt.plot(data["actual_runtime"])
plt.title("Actual Runtime")
plt.xlabel("Index")
plt.ylabel("actual_runtime")
plt.grid(True)
plt.show()
- Click
 at the lower-right corner to run all cells and view the chart.